Studying a population with the Census API
In December 2020, the US Census released the results of the American Community Survey collected between 2015 and 2019. In honor of today’s initial release of 2020 Census data (basic population by race tables, not the full set of responses), I’d like to talk a bit about the Census API. Please note that the 2020 Census is not yet in the API —maybe at the end of September?
While I was looking through the available ACS data at work, I noticed that the Census has a column, C02003_019E, counting population of four or more races, out of the six tabulated by the Census:
White, Black or African American, American Indian or Alaska Native, Asian, and Native Hawaiian or Other Pacific Islander. OMB permits the Census Bureau to also use a sixth category — Some Other Race.
Note that the Census counts ‘Hispanic’ as an ethnicity, leading some Latinos to mark themselves as ‘Hispanic’ ethnicity plus ‘Some Other Race’. The ACS gives specific numbers for Hispanic White or Non-Hispanic White population, but not in addition to the four-or-more race category.
Count by State
Out of nearly 330 million people, the Census figured 91,629 Americans (0.028%) are four or more races. Where do they live?
I get an API Key at https://api.census.gov/data/key_signup.html
Then I make a request of the columns I want, with state:* essentially meaning SELECT {columns} FROM state WHERE TRUEhttps://api.census.gov/data/2019/acs/acs5?get=C02003_019E,C02003_019M,B01001_001E&for=state:*&key=APIKEY
I found out more than a third live in California (16,702) or Hawai`i (15,924).
The least reside in South Dakota (49) and Vermont (21)
If we measure by share of population:
- Alaska is second only to Hawai`i. Washington state, Washington DC, and Nevada all appear ahead of California.
- New Hampshire joins Vermont in the bottom two.
It’s fair to say that four-or-more-races is associated with states which have more Native Americans and Alaska Natives, Native Hawaiians and Pacific Islanders, or all of the above.
Zooming in on geography
The Census lets you dig down into states, counties, tracts, block groups, and blocks. The smallest unit, a ‘block,’ is not necessarily one block in your neighborhood. It can span wide areas, especially in parks or airports where few people live. There is also some messiness around what counts as a county (from states’ historical standards, Virginia’s independent cities, Louisiana’s parishes, Alaska’s boroughs, and DC being one city).
The biggest consequence to you as a developer is the trade-off that the Census makes between zoom level and comprehensive data. The Census is willing to discuss messy personal info in aggregate, for example:
But as you zoom in, these super-detailed columns will return null to protect individuals’ privacy. There are even queries where highly-populated areas will return a value, but the less-populated areas will return null.
The decennial census will give detailed population by race figures all the way down tot he block level, to make it usable for redistricting.
The 5-year ACS doesn’t release info on the block level. You can only get detailed info on the next zoom out: block groups.
For our 4+ races column C02003_019E I can design searches to break down California by county
https://api.census.gov/data/2019/acs/acs5?get=C02003_019E,C02003_019M,B01001_001E&for=county:*&in=state:06&key=APIKEY
Here I’m SELECTing FROM county WHERE state=06. That number comes from the Census FIPS codes, which give two digits to a state, then three digits for the county or equivalent, etc. etc. using a mostly alphabetic, mostly odd numbers to support name changes, occasionally arbitrary order.
[["C02003_019E","state","county"],
["13","06","047"],
["322","06","075"],
["0","06","049"],
...
Here we see 13 multiracial people live in Merced County (06047); 322 in San Francisco (combined city and county), and 0 in Modoc (06049).
Where do they live within SF? I keep zooming to block group level:
[["C02003_019E","state","county","tract"],["47","06","075","047901"],
["0","06","075","012301"],
["109","06","075","017601"],
...
Here we can construct a longer FIPS code (06075017601) combining the state, county, then tract. We see only a handful of tracts recorded people with this trait. When I Google 06075017601, I get a dataset page with more info, and a map showing it is in SoMa.
But do we know for sure that there are nearly a hundred 4+ race people in the general SoMa area, and none anywhere nearby? That brings us to another detail:
Margin of Error
The Census includes estimates of error. It’s also included some noise — moving people around to be accurate in aggregate and not too specific individually. The 2020 Census is introducing some differential privacy to anonymize location better.
Anyway when looking at the 1-year ACS, CensusReporter.org indicates that Vermont and DC had possibly zero or negative population of four or more races.
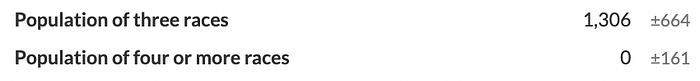
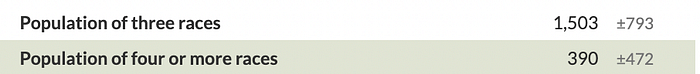
Of course the Census would not support a negative population.
The margin of error is less dramatic when we extend to the ACS 5-year: 21 ± 18 for Vermont, and 373 ± 218 for DC.
We can add margin of error for each row of results in the API by looking up our column C02003_019E and seeing margin of error column is named C02003_019M .
All of the 0-population tracts are actually 0±12. And the SoMa tract is actually 109±179.
This did inspire me to zoom back out to the county level and see the total number in San Francisco is 322±218.
Conclusions
Working with small populations is tough. There are limits to what the Census will tell us, and when we look too close the error bars are very wide. We can only pin down small numbers in larger aggregate settings.
Updates?
This article was written in August 2021. If I change my recommendations, I’ll post them on this GitHub README.